Test automation metrics: KPI components
In this test automation cycle, I tried to give a detailed overview of the specifics of automation testing services. We went through the process steps, risks, returns. So far, you know that the process bases upon several customary activities:
- Automated test development
- Automated test support
- Test run and result analysis
- Test automation monitoring.
Though, any process doesn’t finish on receiving the result. The process should be evaluated while the team activities show certain KPI. Apart from the usual methods of KPI measurement, I would like to offer you metrics that can be necessary for the evaluation of the first three mentioned activities. Let’s make it clear where to draw attention.
We start with those necessary for automated test development
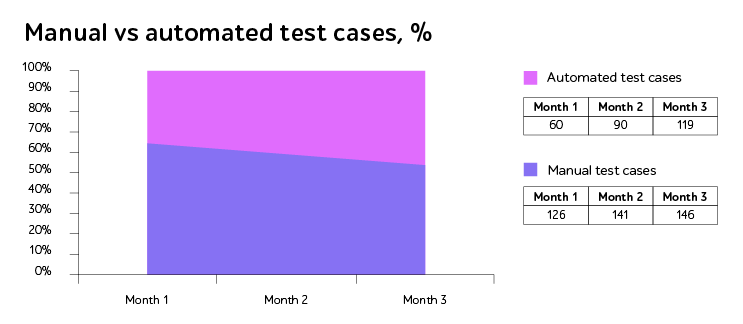
- Automated test coverage (automated tests vs. manual tests). The activity reflects the correlation between automated and non-automated tests. The metric has more an administrative approach than one describing the process specifics. Though used along with the next one it gives quite a transparent activity overview.
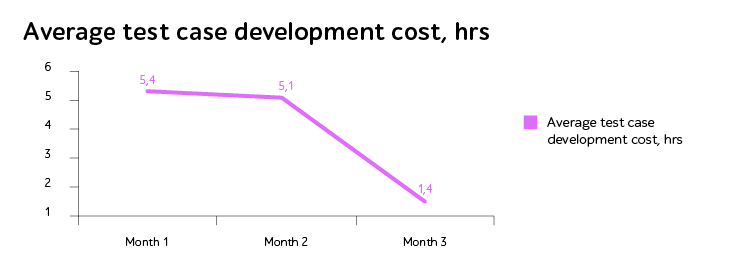
- Cost per automated test. Applying the metric you’ll notice that the price per one automated test decreases. The tendency of cost shrinking is the result of 2 factors: 1) automation solution. The efficient architecture allows engineers to use the code several times. 2) Human factor. People eventually start working faster after careful learning the system of automation solutions.


Earlier, in one of my previous posts of this cycle, I mentioned the time2market parameter, which is important for the efficiency evaluation. The parameter is closely connected to the activity of the test run and result analysis. But take it as the parameter of the process duration. Apply metrics on this step and analyze the time of automated test execution, use smoke test for instance.

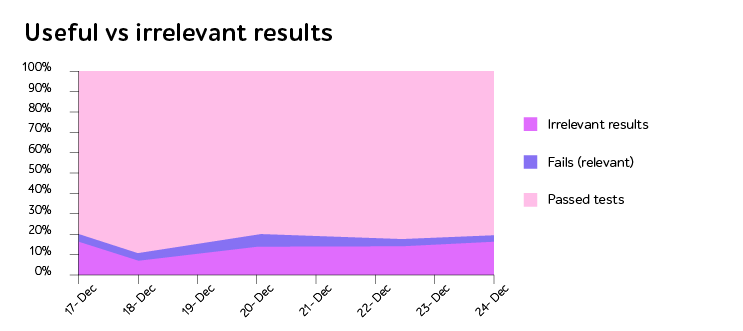
The metric concerning the correlation of useful and irrelevant results gives important information. While applying the metric keep in mind the definition of useful and irrelevant results.
Useful vs irrelevant results
- Useful results: test pass, test failure caused by a defect.
- Irrelevant results: test failure – problems with the environment, data-related problems, changes in the application (business logic and/or interface).
The irrelevant results are those that decrease the automation efficiency from the economic and duration point.
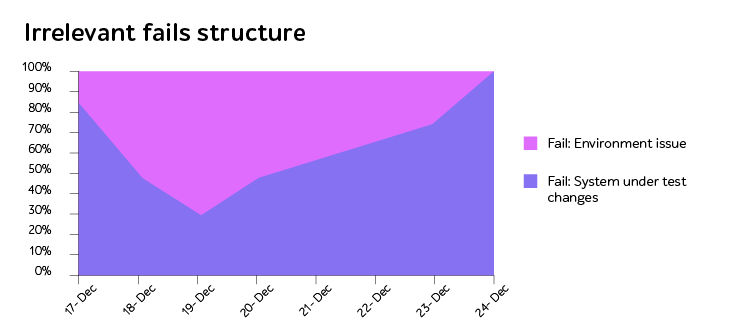
The percentage of the irrelevant fails is also the data used in metrics. The acceptable percentage level depends upon the project, though the figure of 20% can be used a basic adequate level.

If the rate of the irrelevant results exceeds the acceptable level, pay special attention to the source of the issue. Lower in the diagram you can see how changed the automation process after elimination of the secondary issues. The diagram was made on one of our latest projects.

So in a nutshell, being aware of automation process specifics and methods of efficiency evaluation, you have the basic information necessary for tracking the process. Now you are able to find the reasons for your automation project success to keep up with and understand what and why went wrong. Still, there always are some things to know more and I am always ready to provide you with the necessary details.


